Housing is, by its very nature, place-based. As a result, the way we develop a deeper understanding of housing issues is to understand them spatially – in the context of place. A simple but effective approach to systematizing place-based understandings is to visually represent a variety of characteristics and facts that describe a particular place on physical maps.
The exercise of geographically-rooted asset mapping can provide states with rich information by population group; it is a way to highlight both challenges and available resources in relation to needs. The combination of these things is almost always unique to a place.
Mapping information in this way is critical to ensuring that policy and programmatic decisions are utilizing the available assets and addressing the relevant needs of the community. For effective health and housing approaches, it’s important for states to understand this kind of information at the community, neighborhood, and household levels.
Key Takeaways
- Spatial data can be a bridge between anecdote and data-based knowledge.
- Understanding barriers is a macro exercise – alleviating them is always micro.
- Effective resource allocation strategies acknowledge nuance and variance as keys to success.
Background
Representatives from North Dakota’s Department of Health and Human Services and Housing Finance Agency participated in NAHSP’s 2021 – 2023 Health and Housing Institute. The North Dakota team completed a needs and asset mapping exercise to understand more about their population of focus and where there are gaps and opportunities to support them. Jessica Thomasson presented their process and results at NASHP’s 2023 Annual Health Policy Conference during the preconference, Keeping Pace with Basic Needs: Cross-Agency Approaches to Align Health and Housing Systems. This blog summarizes Thomasson’s presentation.
The North Dakota team’s target population is households experiencing housing crisis or who are at risk of housing instability. The North Dakota team takes the perspective that economic health, physical health, and behavioral health are the foundations of wellbeing, and the loss of housing stability is destabilizing to all three domains of wellbeing.
Understanding the Geographic and Demographic Context
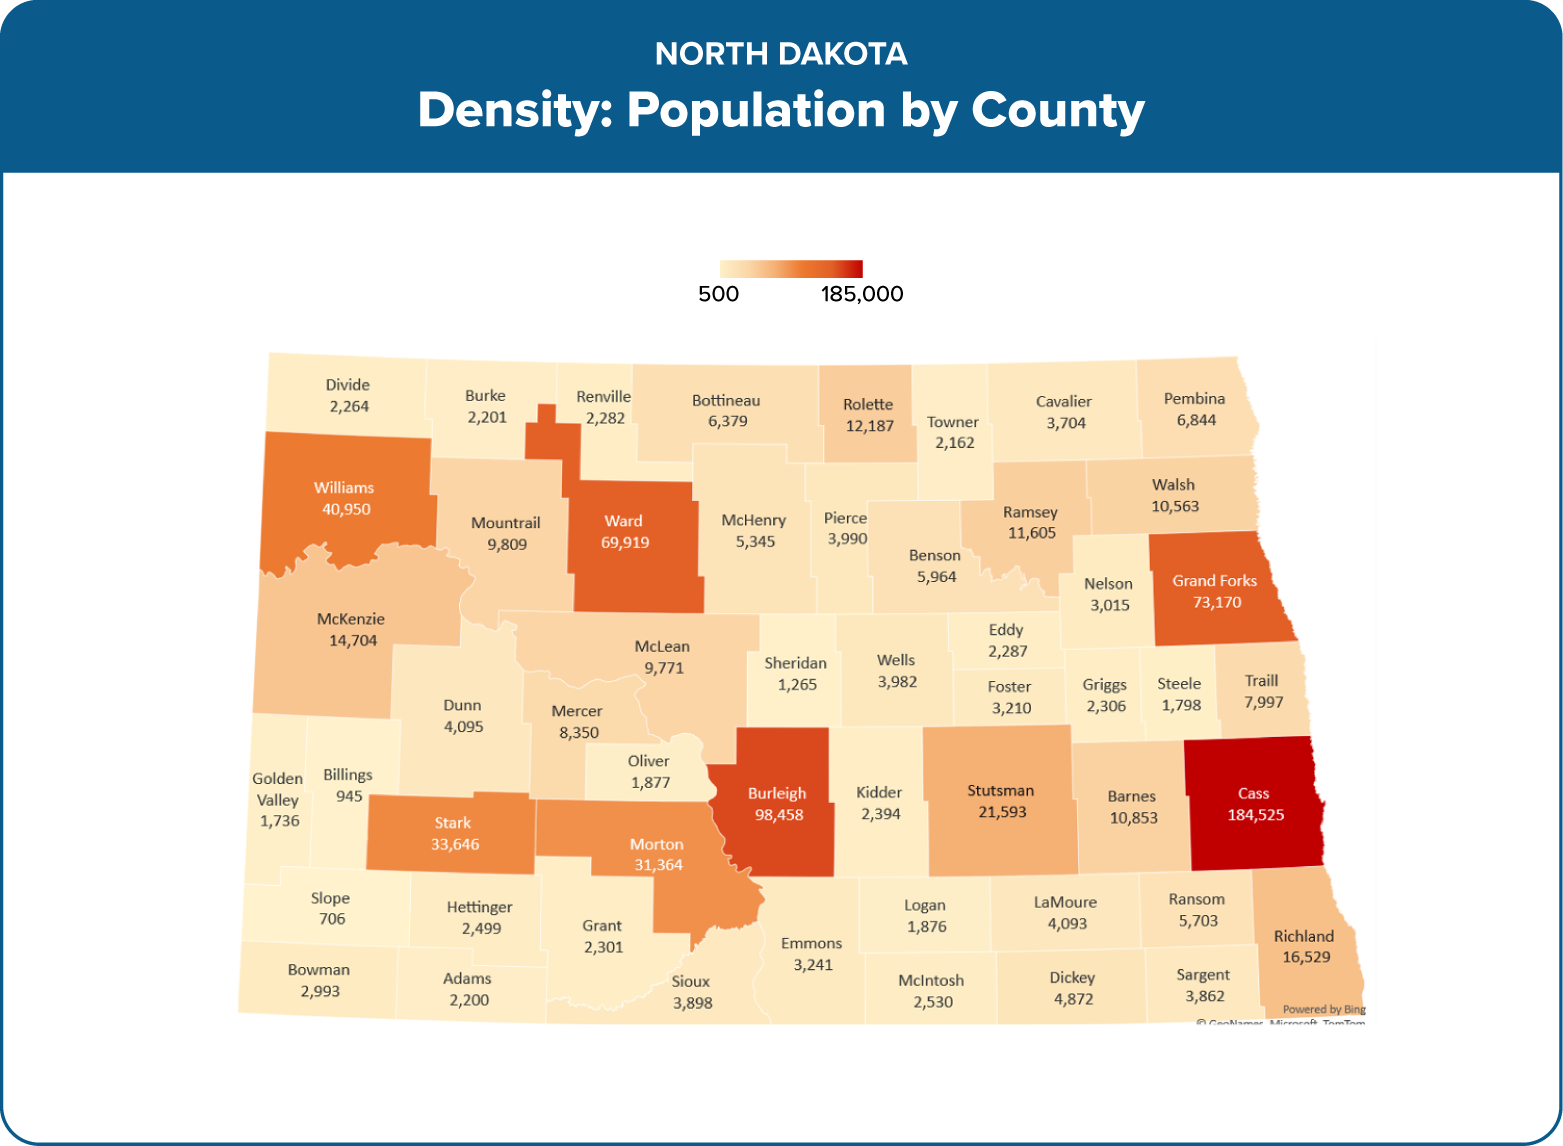
The North Dakota team began their mapping exercise by looking at population density, population change, age, and other sociodemographic patterns to inform and provide context for the rest of the mapping exercise. The team utilized data from the October 2022 North Dakota Statewide Housing Needs Assessment and a Housing Finance Agency report on The Current State of Housing in North Dakota.
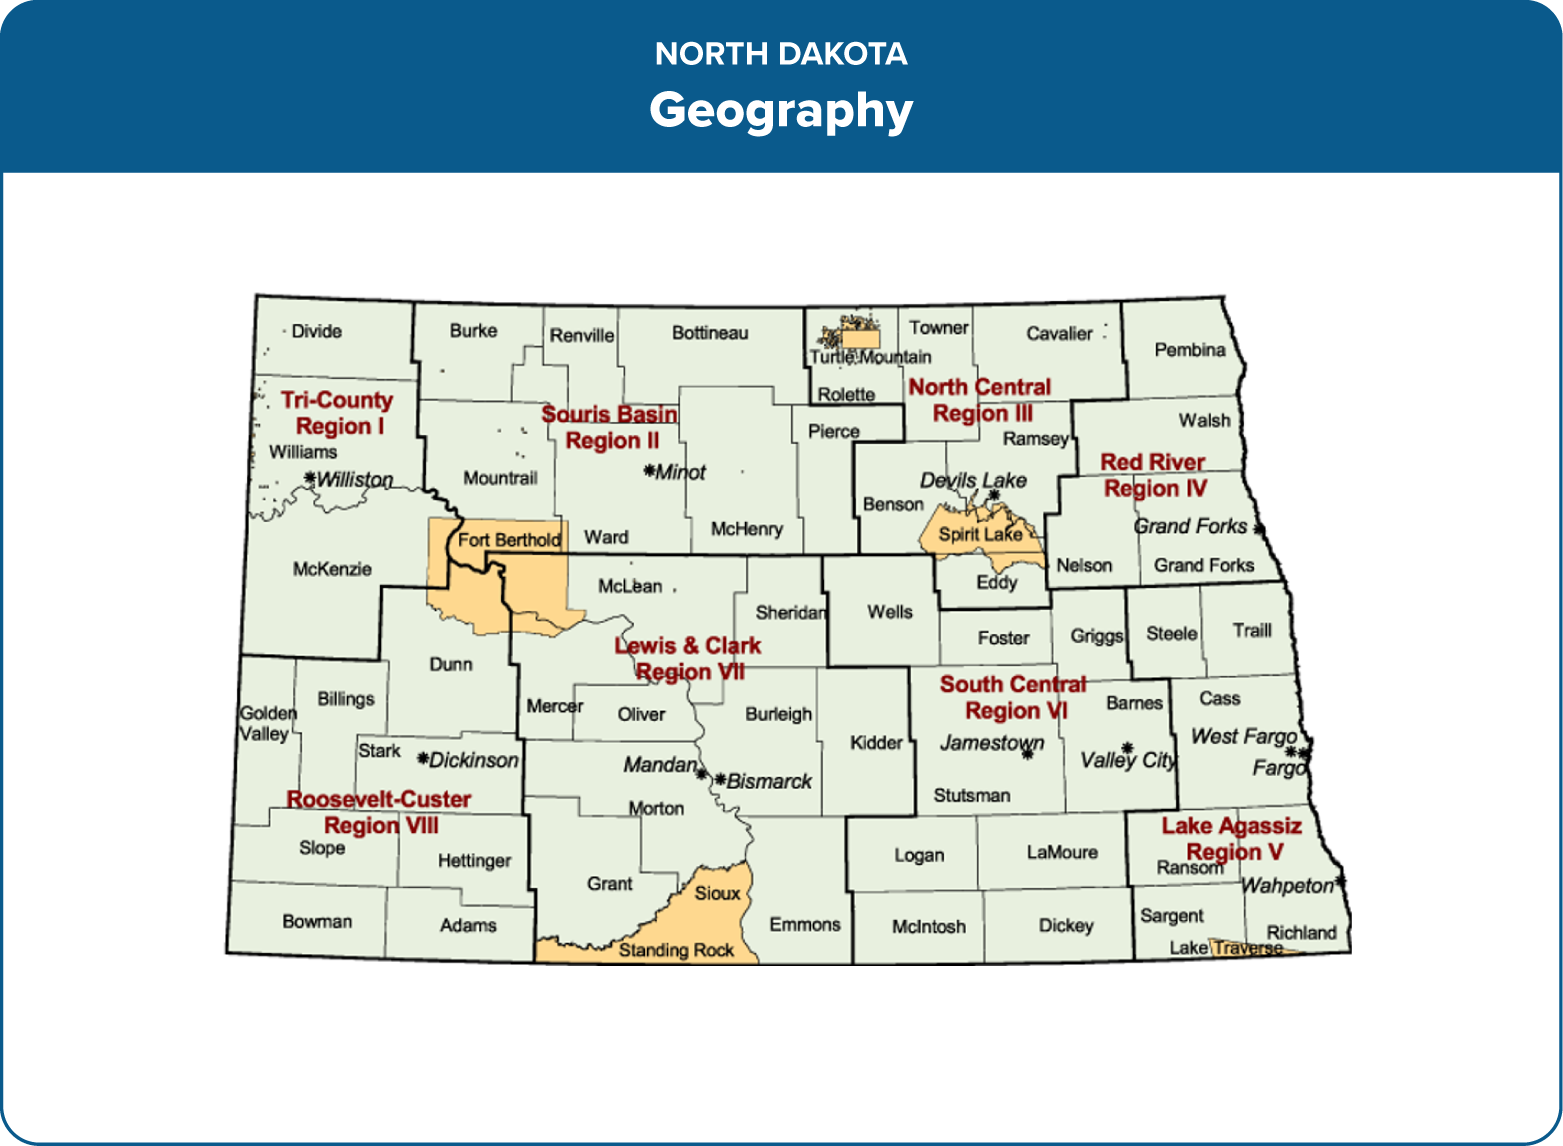
North Dakota is a rural and frontier state with 780,000 people located across 53 counties, 19 human service zones, and 8 human service regions. There are 5 Tribal nations with land area that is within the state’s geographic boundaries. The state has two metropolitan statistical areas (Fargo/ Moorhead and Bismarck Mandan) with 55% of the total state population residing in the five largest cities. Only 13 cities in the state have a population of more than 5,000 people.
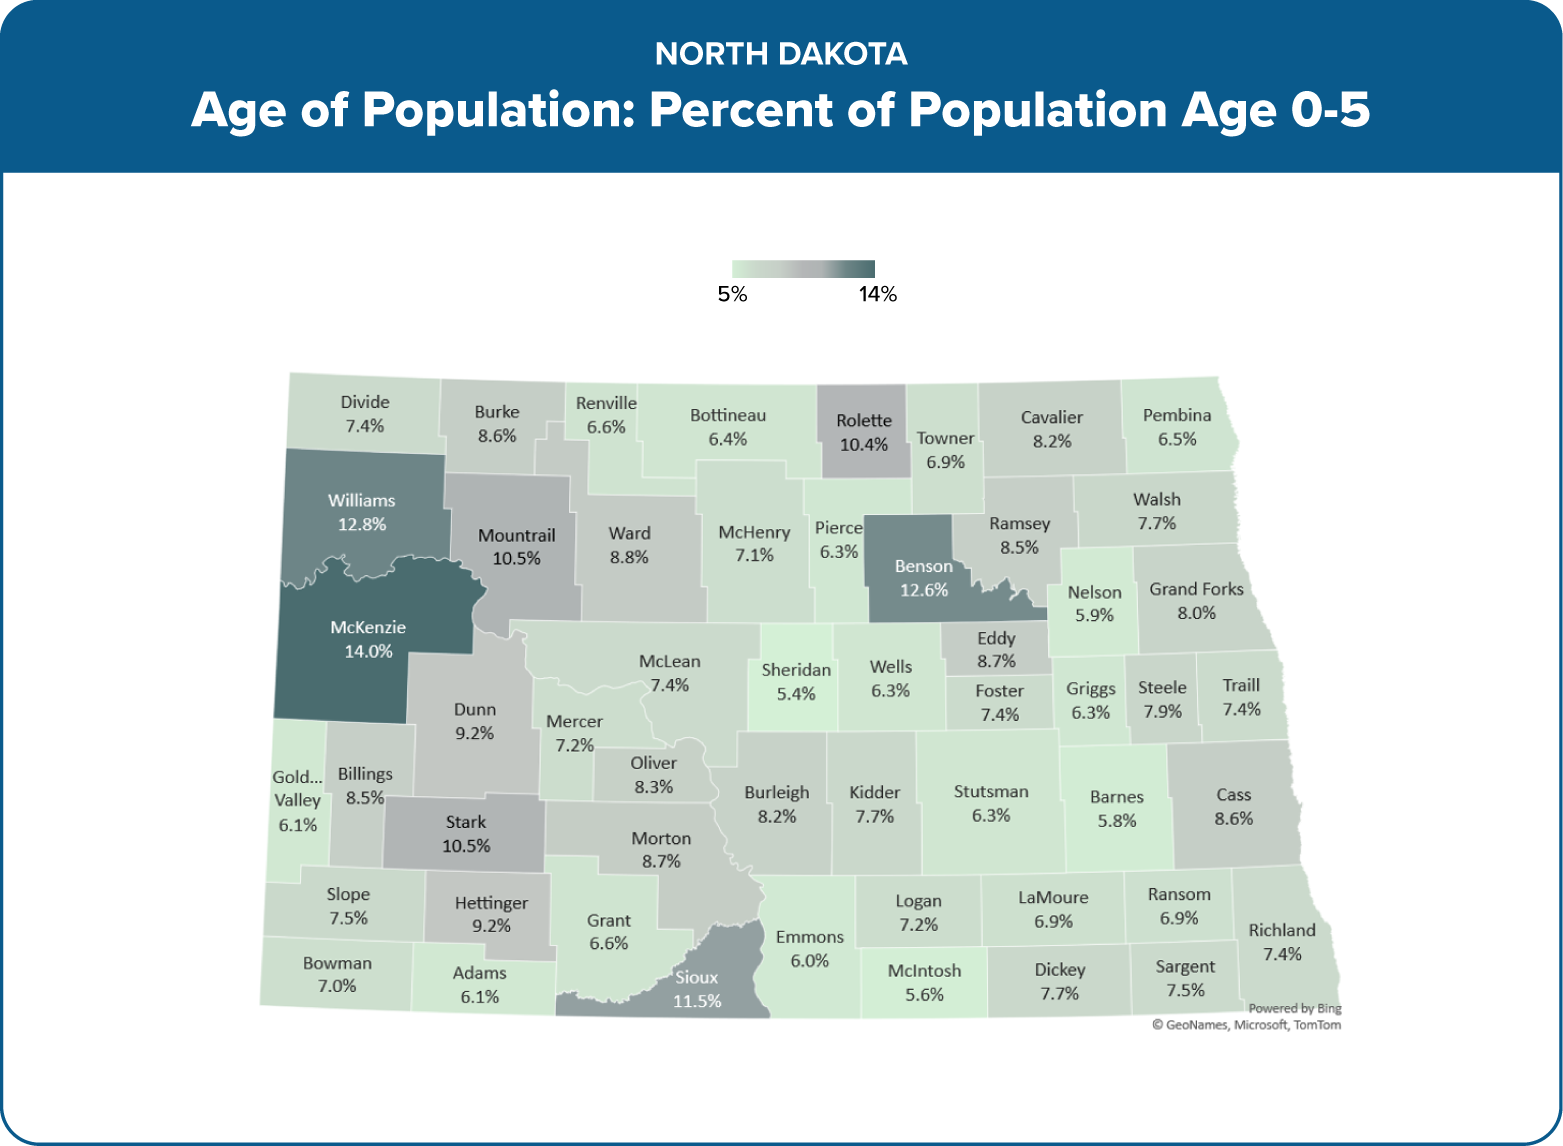
The age of the population varies widely by county, indicating differing barriers to housing stability by geography. While North Dakota as a whole is aging, in at least seven counties there are large populations of children, with 10% or more of the population 0 – 5 years old.

Housing Support Services
As a function of the practical realities of its geography and population patterns, North Dakota uses a hub and spoke model of service delivery for housing-related services.1 There are a handful of agencies that function as intermediaries, forming a decentralized service delivery network. The service delivery network is made up of a combination of formal and informal caregiving systems. While the state has some information on the location of providers, the information is complicated by the specifics of what areas they are willing to serve, where staff is located, whether staff are prepared to deploy, and what services those staff are able to provide.

Homelessness, Housing Instability, and Barriers to Housing
Visualizing homelessness and housing instability is an important grounding point in the mapping process. In addition, spatial identification of household economic risk factors offers a deep understanding that goes beyond just ‘poverty rate’ alone and is a useful guide to investment in non-medical risk factors that affect health and wellbeing.
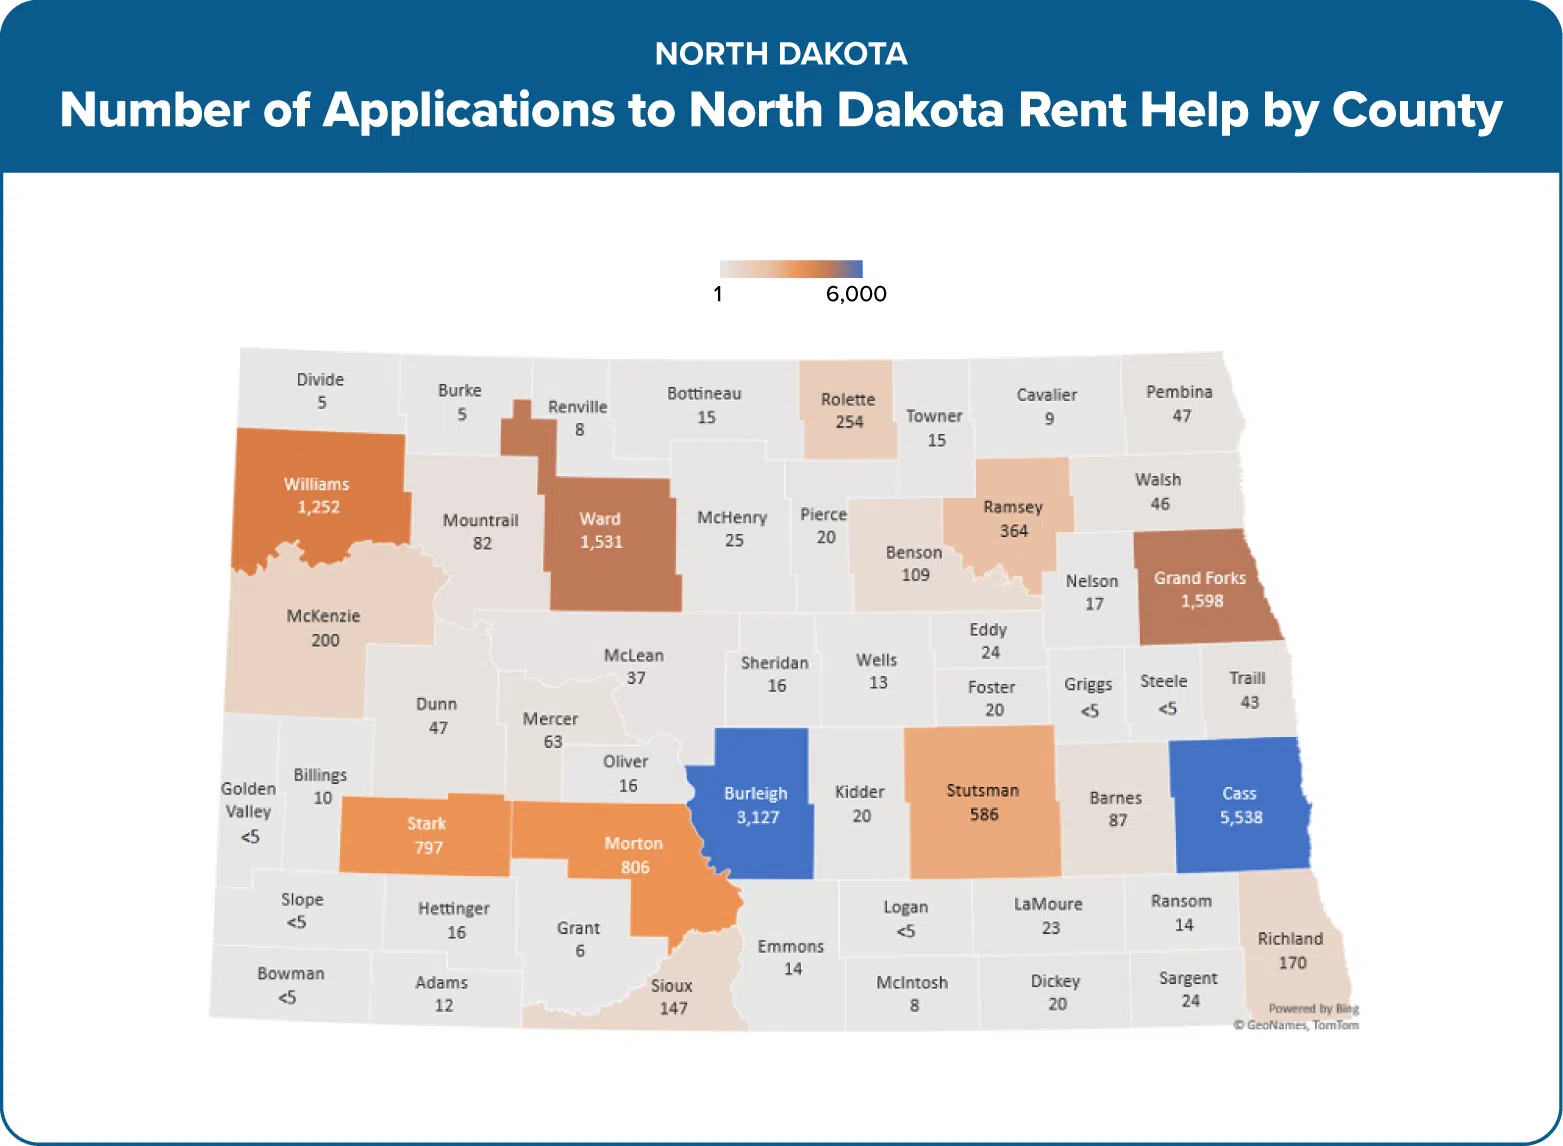
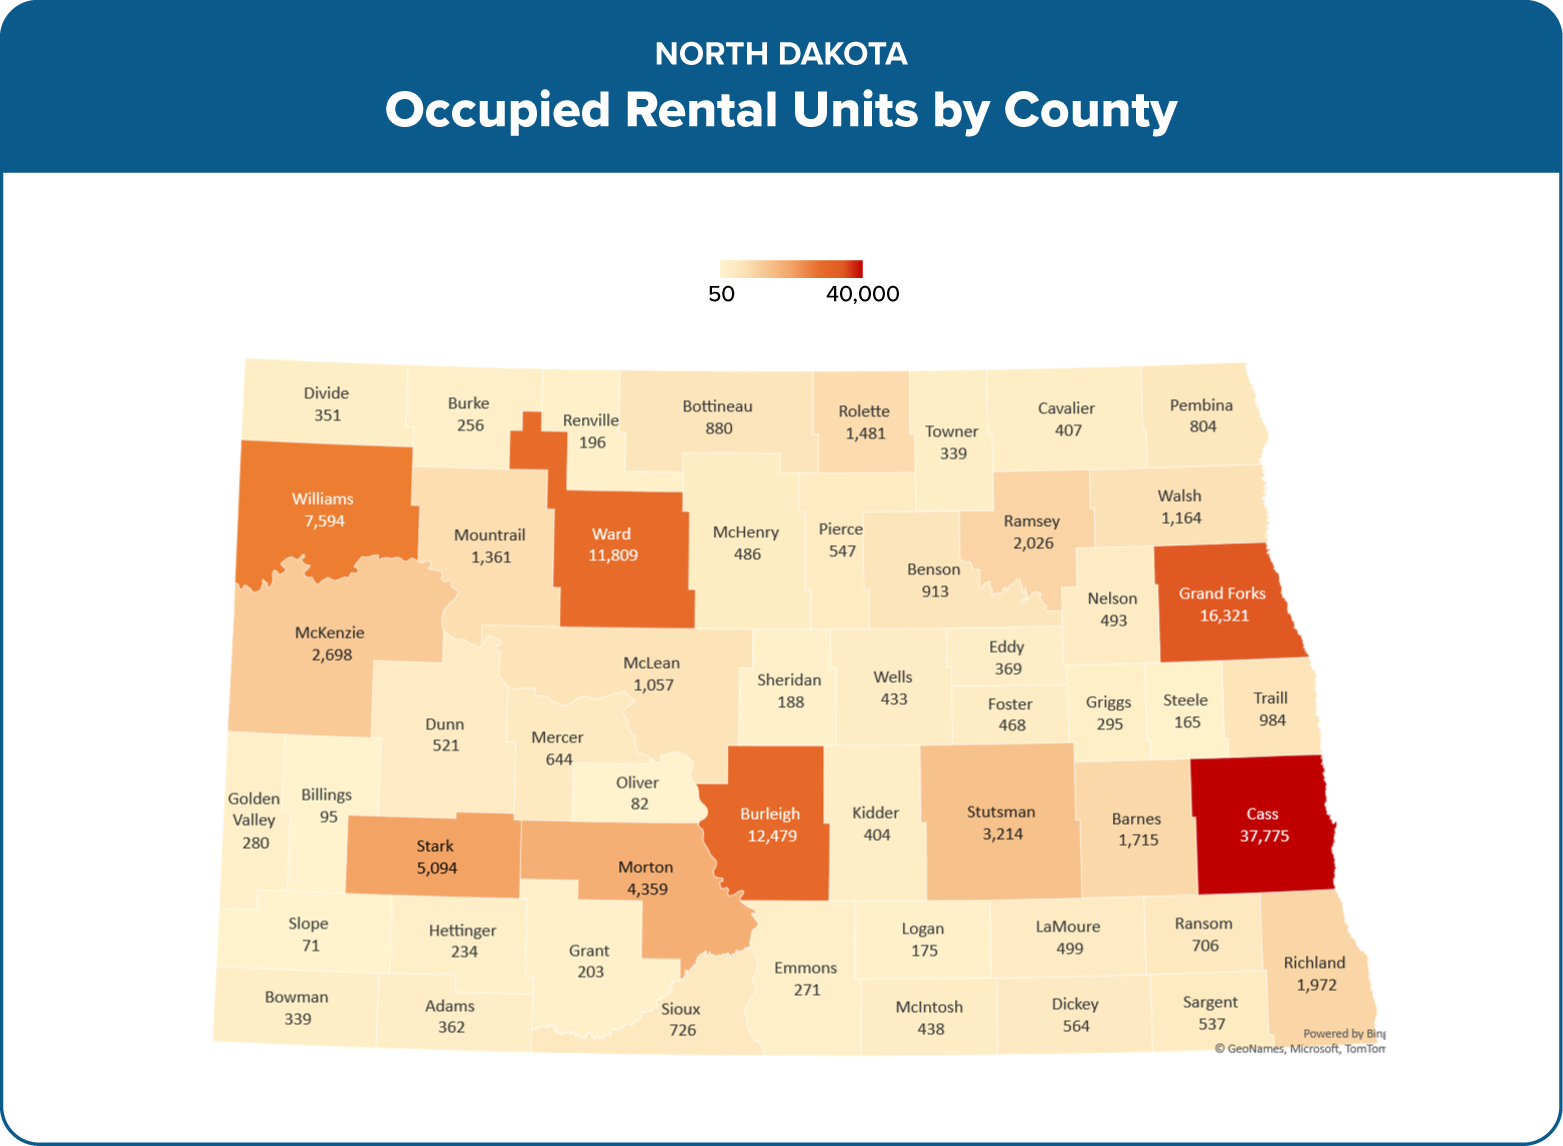
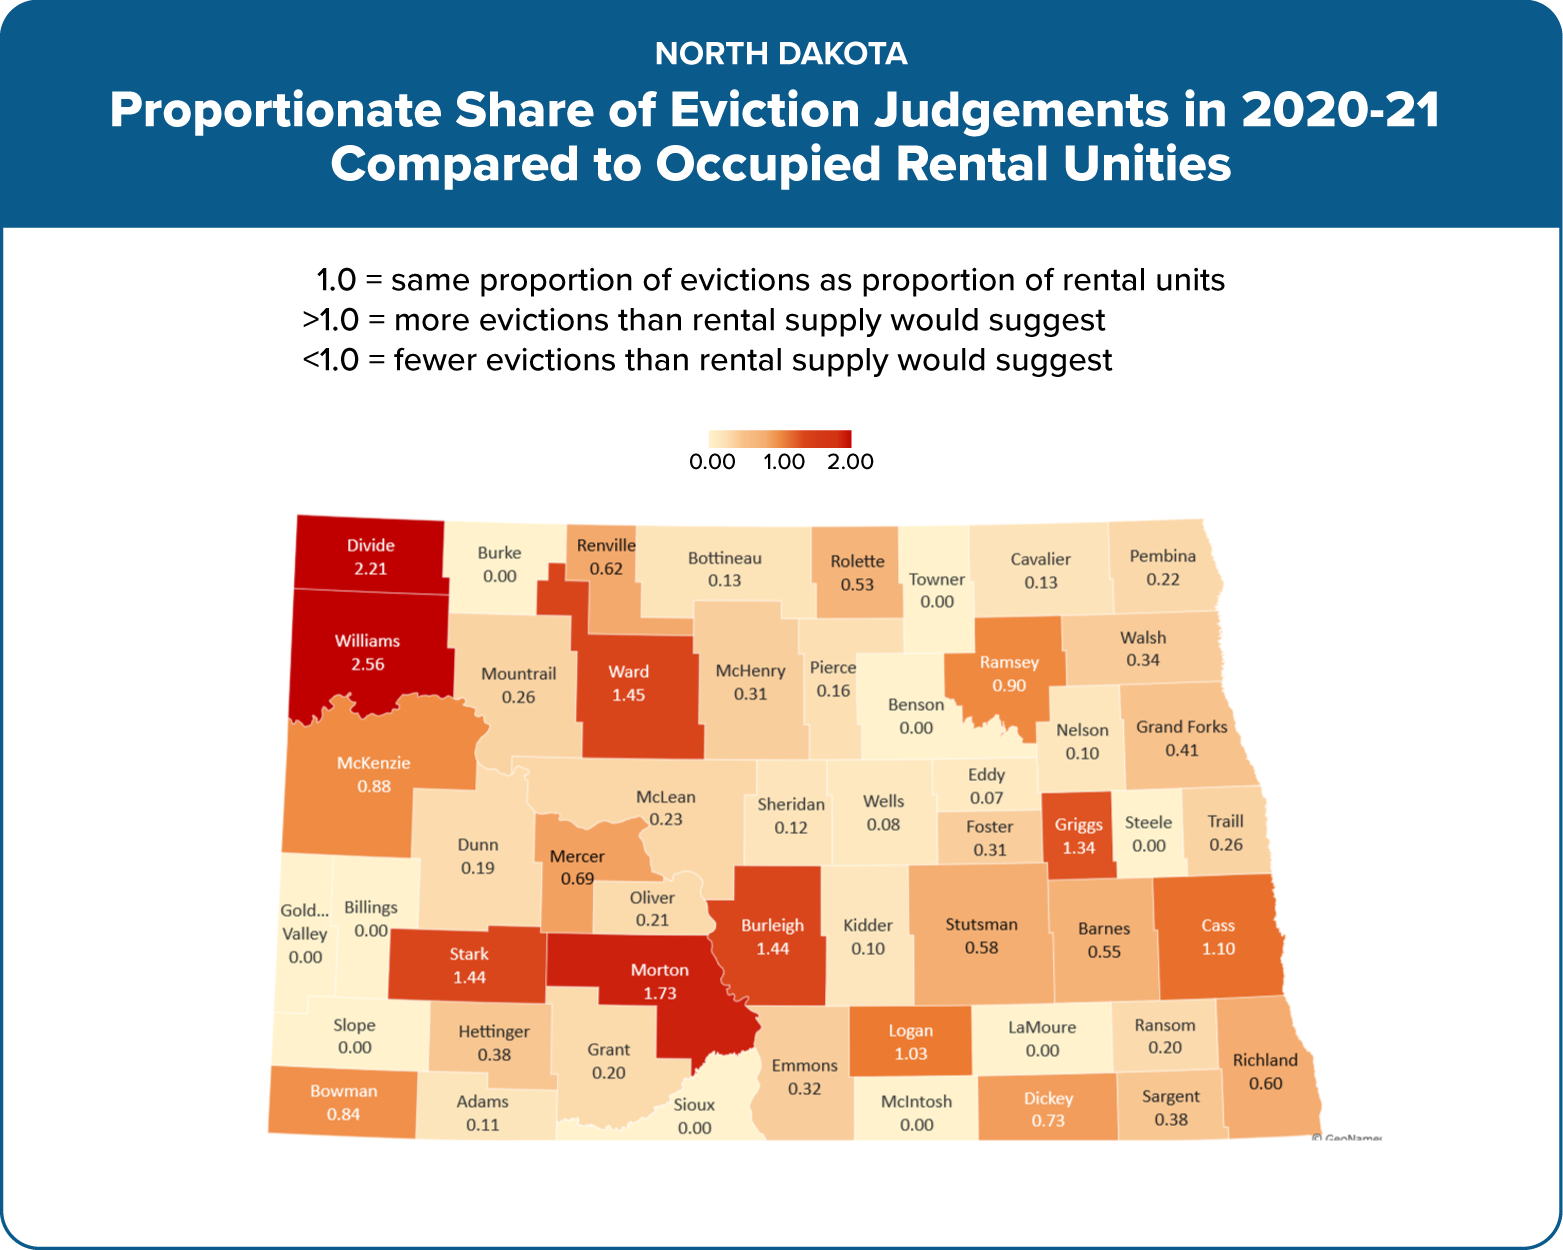
From October 2021 to July 2023, 17,325 people who were experiencing homelessness applied for assistance through North Dakota Rent Help (NDRH), 28% of whom were children. Households experiencing homelessness are located in communities across North Dakota’s geography with some concentration around the larger cities in the state. There were 380,000 total housing units in the state in 2019 – 38% occupied rental
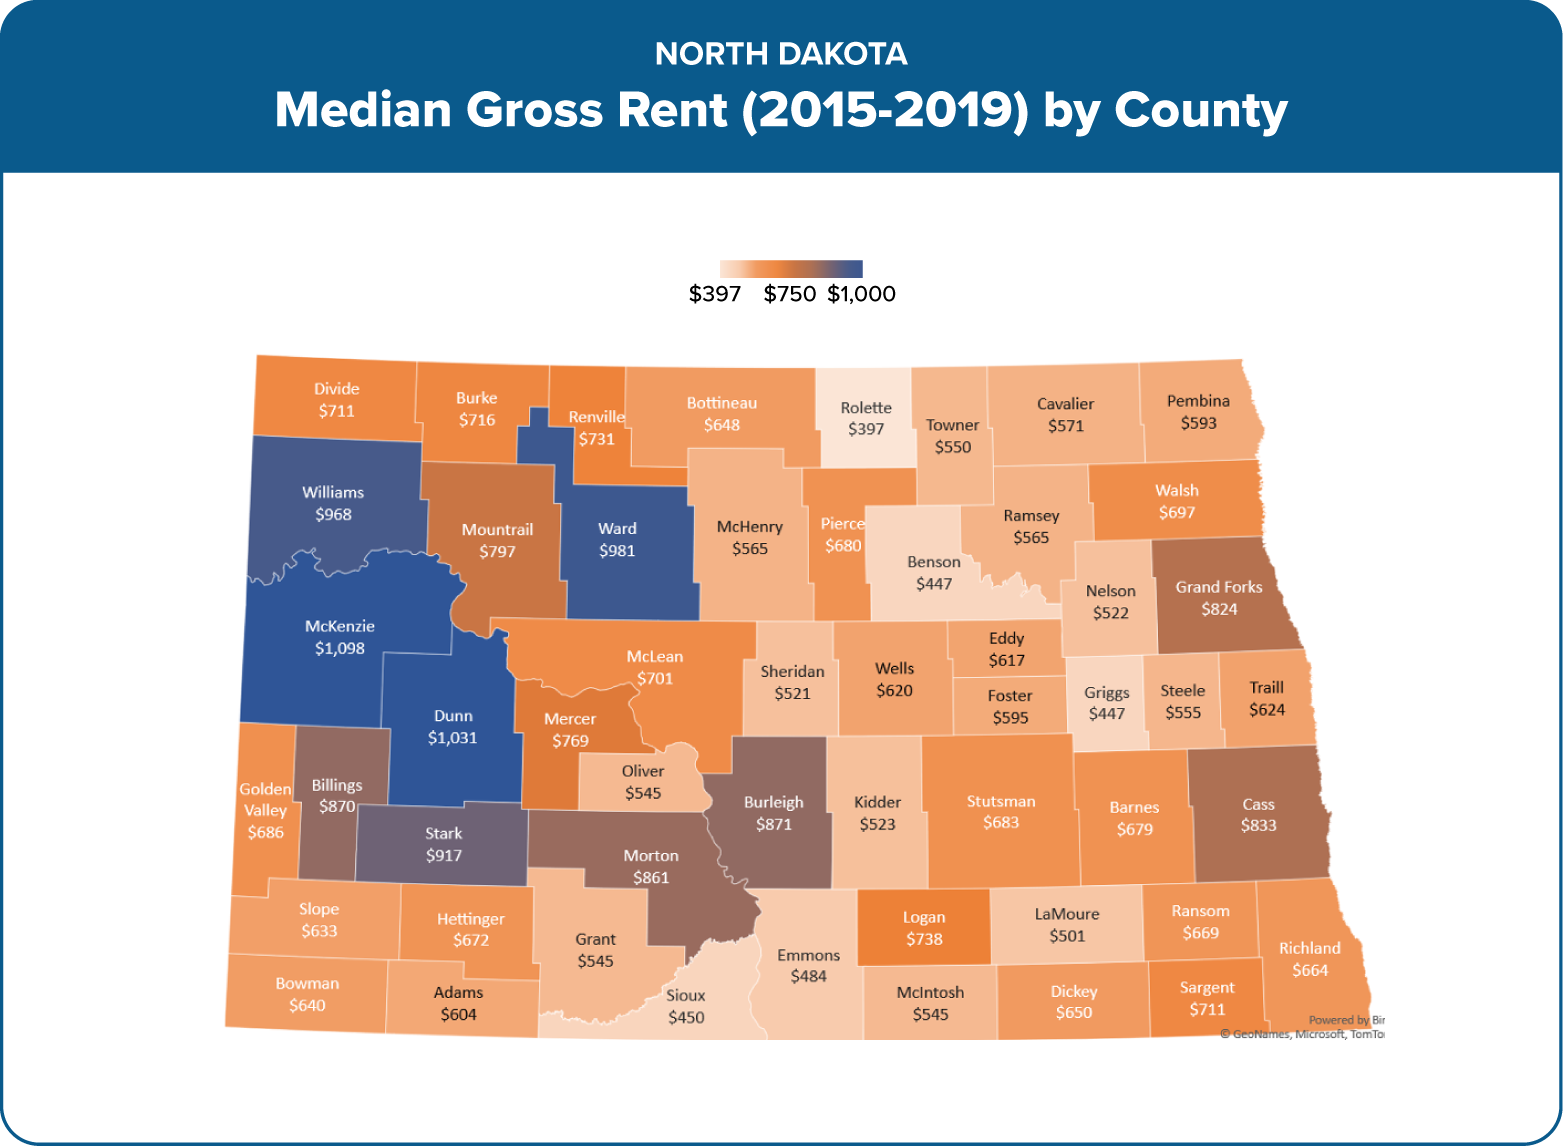
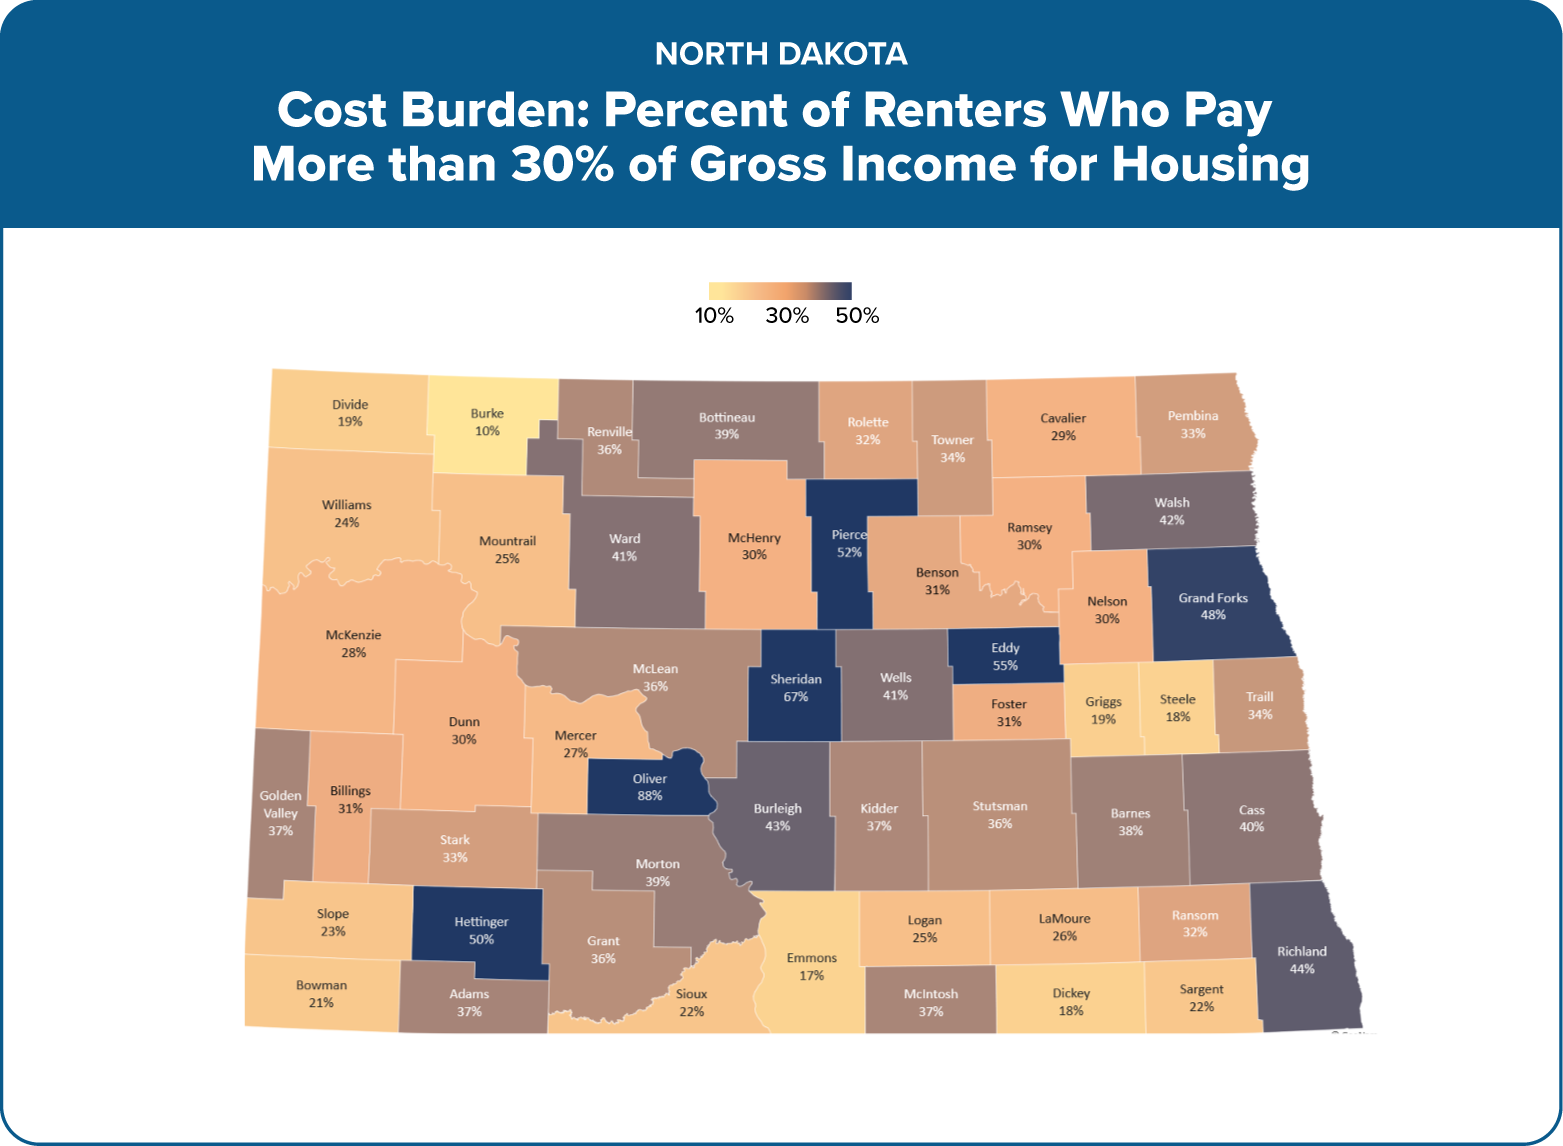
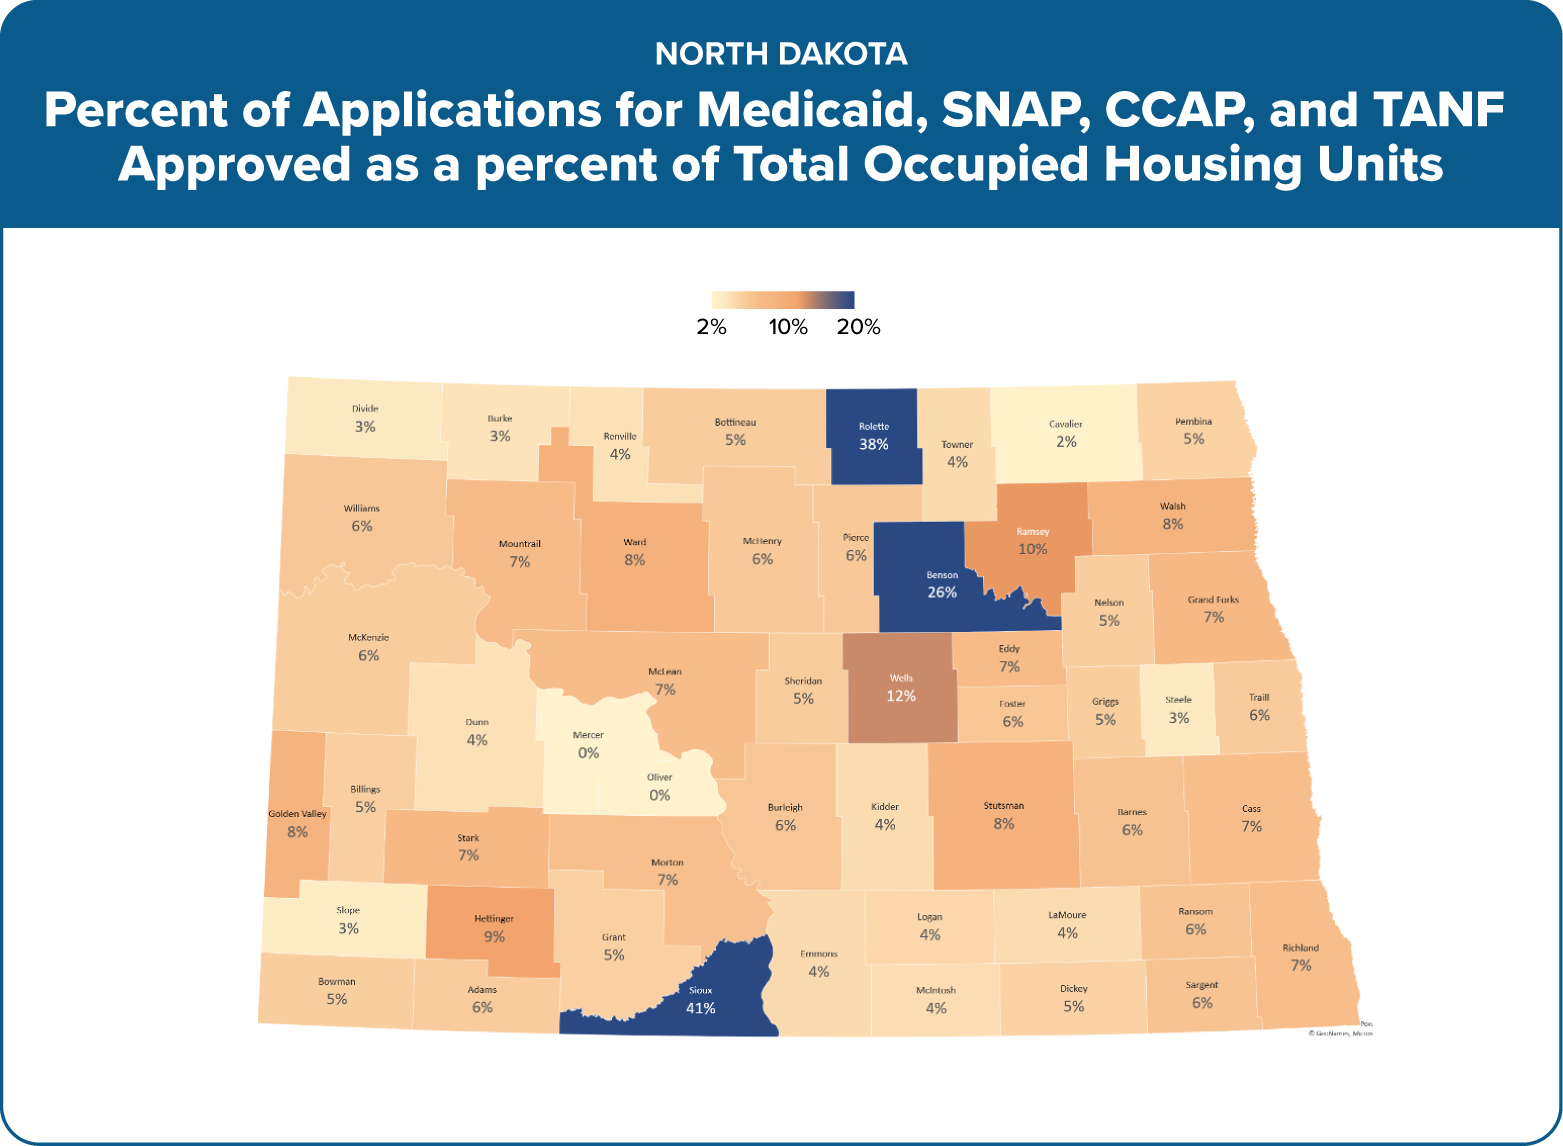
In 2020 – 2021 there were 2,800 eviction filings per year and 1,800 formal judgments. Eviction prevalence is generally higher in counties where economic conditions are more volatile and where average rents are higher. Significant risk-factors for evictions and housing instability include presence of disability that limits or prohibits work, housing cost burden, older age householders with limited resources and health issues, presence of substance use disorders that threaten employment or housing status, and households that exist in the hardship gap exemplified by the ALICE framework (asset-limited-income-constrained-employed). To understand these conditions, North Dakota used a combination of data from NDRH and their HMIS (Homeless Management Information System), PIT (point in time) count, DPI (Department of Public Instruction) Homelessness, and combined eligibility Self-Service Portal (includes Medicaid, SNAP (Supplemental Nutrition Assistance Program), CCAP (Child Care Assistance Program); TANF (Temporary Assistance for Needy Families); and LIHEAP (Low Income Home Energy Assistance Program)).
Next Steps and Opportunities
The North Dakota team plans to better understand the target population by geographic typology and adjust their approaches accordingly. They plan to:
- Use spatial data to gain contextual understanding of risk, triggers, and indexed program utilization rates;
- Target housing stability services according to household status based on history of housing instability / urgency of crisis matrix;
- Realign formal systems to understand, recognize and compensate informal supports; and
- Create sustainability for housing stability supports including navigators and coaches.
Seeing the information together and spatially displayed can inform how policy and resources are applied. Spatial display of data can also be an effective form of communication with policy makers, all of whom are genuinely rooted in a sense of place. Ultimately, the understanding that derives from this type of layered information sharing can help guide decisions on how to target limited human and financial resources to reach policy goals.
1 North Dakota was the second state in the nation to use Medicaid to fund tenancy support services through a Medicaid 1915(i) state plan amendment. In 2020, the state received federal approval to include a variety of new services in their state Medicaid plan for persons with behavioral health needs. There were 12 new services added to the state plan for this population, including housing supports. Housing support services help people obtain and maintain housing in the community and live a life integrated with the community.
Acknowledgments
NASHP is thankful for support of this project by the Health Resources and Services Administration (HRSA) of the U.S. Department of Health and Human Services (HHS) under the National Organizations of State and Local Officials co-operative agreement.